



Intelligent | Analytical Report | October 2026
Introduction: Where Is Smart Money Heading on Wall Street?

In financial markets, changes in institutional investors’ portfolios are among the most important indicators of capital flows across sectors and asset classes. Examining the investment activity of firms such as Bridgewater Associates, BlackRock, and Berkshire Hathaway can help analysts better understand changes in equity market exposure, portfolio concentration, and risk management priorities. (Investor.gov, n.d.; U.S. SEC, 2026a)
In the second quarter of 2026, Bridgewater increased its positions in funds tracking the S&P 500 while simultaneously reducing its shareholdings in numerous technology and semiconductor companies. BlackRock, by contrast, reported modest increases in its holdings across many large technology companies. Berkshire Hathaway is also important to examine because its investment structure differs from those of the other two firms. (State Street Global Advisors, 2026; BlackRock, 2026a)
These differences demonstrate that “smart money” does not necessarily follow a single strategy. Each institution’s investment decisions are influenced by its business structure, investment horizon, client base, and risk management constraints.
Form 13F Filings: A Tool for Tracking Institutional Capital
Form 13F is one of the most important public sources for examining the equity holdings of institutional investment managers in the United States. Managers subject to these reporting requirements must disclose certain securities under their management to the U.S. Securities and Exchange Commission (SEC) within 45 days after the end of each quarter. (U.S. SEC, 2017; U.S. SEC, 2026a; Investor.gov, n.d.)
Filings for the second quarter of 2026 reflect reportable positions as of June 30.
However, these disclosures have limitations. Form 13F does not cover all of an institution’s assets, including many short positions, cash holdings, and certain derivatives. Furthermore, an increase in the market value of a position may result from rising share prices rather than additional purchases. (U.S. SEC, 2017; Investor.gov, n.d.)
For a more accurate analysis of institutional investment behavior, changes in share counts, portfolio weights, and position values should therefore be examined together.
Bridgewater Associates: Increasing Index Exposure While Reducing Direct Concentration in Technology
Bridgewater Associates is one of the world’s best-known investment management firms, recognized for its systematic approaches and macroeconomic analysis.
In the second quarter of 2026, one of the most significant observable changes in Bridgewater’s portfolio was an increase in the number of shares held in exchange-traded funds tracking the S&P 500. (State Street Global Advisors, 2026; iShares, 2026)
Significant Increases in SPY, IVV, and VOO Positions
At the end of the second quarter, the SPDR S&P 500 ETF Trust (SPY) was Bridgewater’s largest reported position.
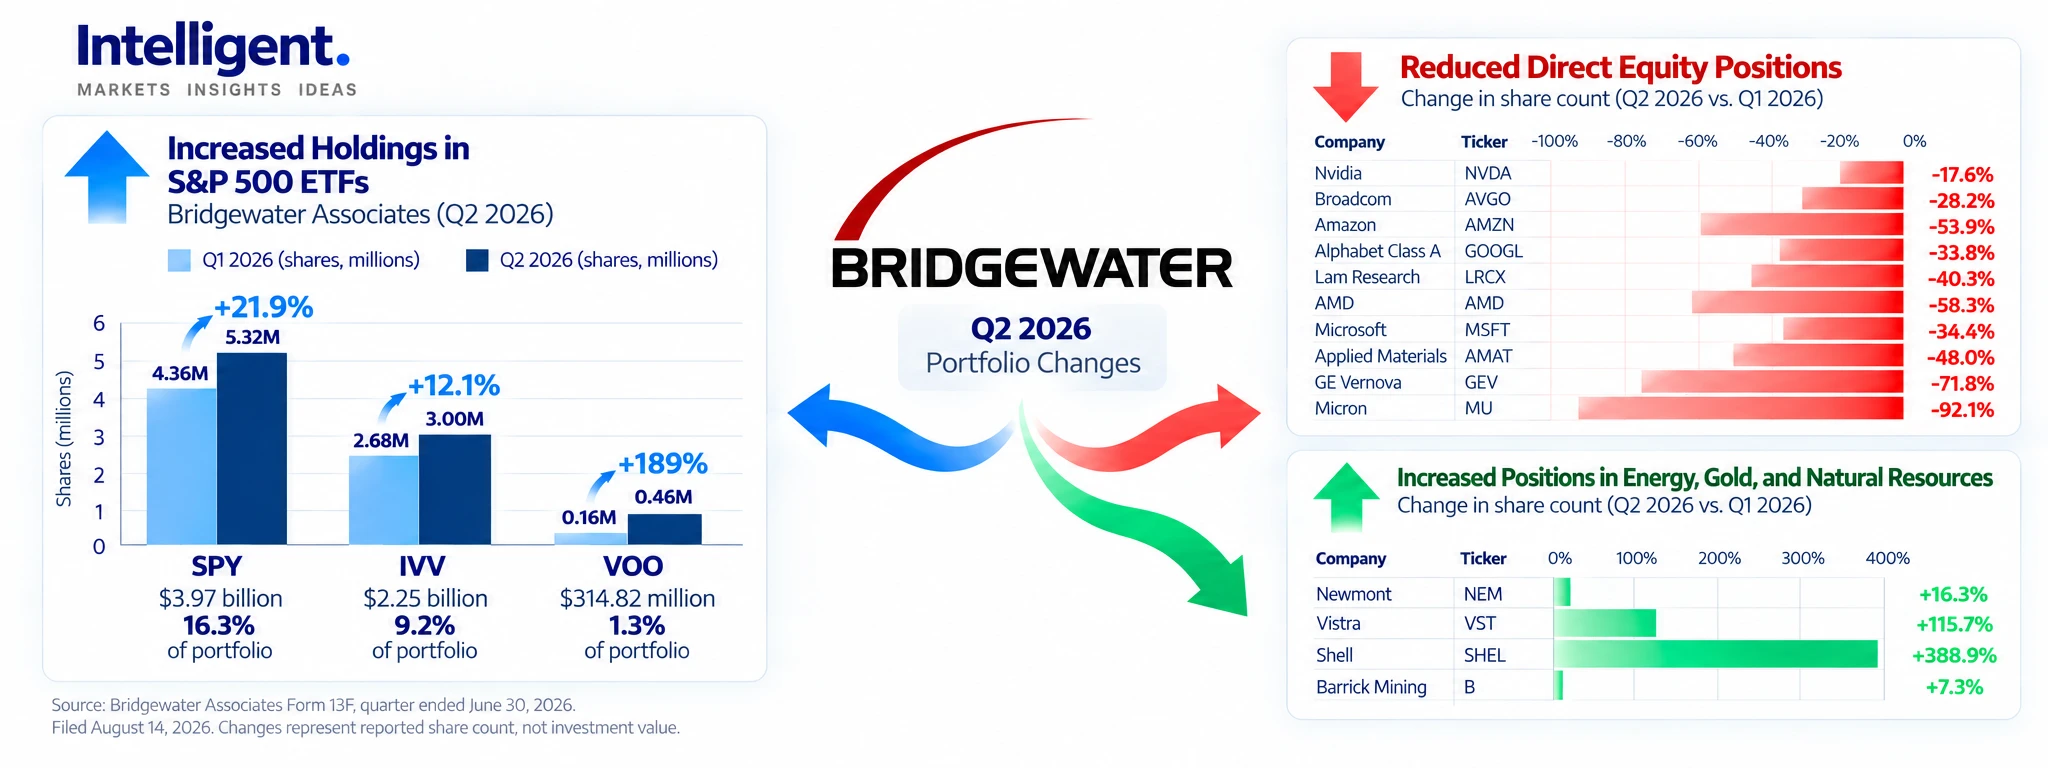
The firm’s holdings in this ETF reached 5.32 million shares, representing a 21.9% increase compared with the first quarter. The position was valued at approximately $3.97 billion, accounting for 16.3% of the reported portfolio.
Bridgewater’s second-largest position was the iShares Core S&P 500 ETF (IVV). Its holdings increased by 12.1% to 3 million shares, with a reported value of approximately $2.25 billion.
During the same period, Bridgewater increased its holdings in the Vanguard S&P 500 ETF (VOO) by 189%, bringing the position to approximately 458,000 shares. (State Street Global Advisors, 2026; iShares, 2026)
Figure 1. Bridgewater increased its positions in three S&P 500 ETFs.
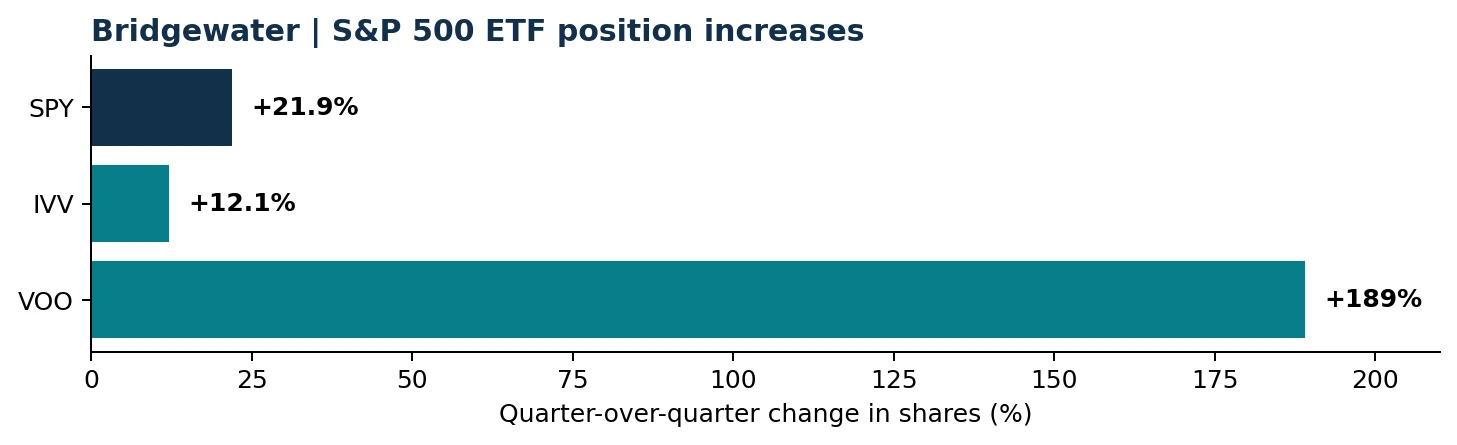
Together, these three ETFs accounted for approximately 26.8% of Bridgewater’s reported portfolio. These changes indicate that Bridgewater increased its exposure to the broader U.S. equity market through index-tracking funds during the second quarter. (State Street Global Advisors, 2026; iShares, 2026)
Reducing Direct Positions in Technology and Semiconductor Stocks
Alongside its increased index exposure, Bridgewater reduced its shareholdings in numerous technology and semiconductor companies.
Its Nvidia position declined by approximately 17.6%, leaving the firm with around 3.87 million shares. Its Broadcom holdings also decreased by 28.2%.
The reduction in Amazon was more substantial, with the share count falling by 53.9% to approximately 2.03 million shares. Within the semiconductor sector, Bridgewater reduced its AMD holdings by approximately 58.3% and its Micron holdings by approximately 92.1%.
Figure 2. Bridgewater reduced several direct technology and semiconductor holdings.
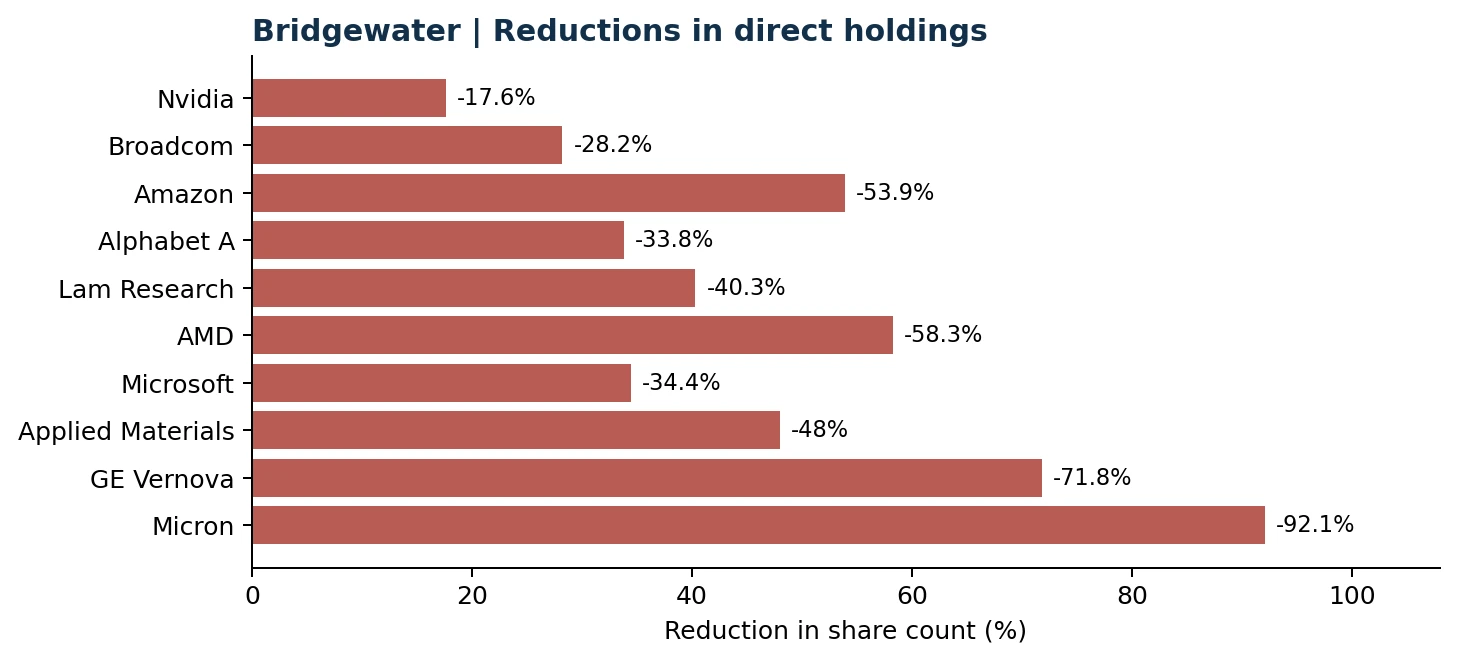
These reductions indicate that Bridgewater lowered its direct exposure to a range of technology companies within the publicly reported portion of its portfolio. However, this does not mean the firm exited the technology sector entirely. SPY, IVV, and VOO also allocate substantial portions of their assets to large technology companies. (U.S. SEC, 2017; State Street Global Advisors, 2026; iShares, 2026)
Increasing Exposure to Energy, Gold, and Natural Resources
Alongside its reductions in direct technology positions, Bridgewater increased its holdings in several companies operating in energy, natural resource extraction, and electricity generation.
Its holdings in Newmont, a major gold mining company, increased by 16.3%, bringing the position’s value to approximately $251.73 million. Bridgewater also increased its shareholdings in Vistra by 115.7%, with the position reaching approximately $119.24 million in value.
During the same quarter, the firm increased its Shell holdings by nearly 388.9%, bringing its position to approximately 1.53 million shares. Its holdings in Barrick Mining also increased by approximately 7.3%.
These developments suggest that increased exposure to energy and natural resources, alongside broader investment in index-tracking funds, was a notable feature of Bridgewater’s second-quarter portfolio changes.
Analytical Interpretation: Rebalancing Risk Exposure
Bridgewater’s overall portfolio changes can be interpreted as a rebalancing of its equity market exposure. On one hand, the firm increased its holdings in index-tracking ETFs. On the other, it reduced its direct shareholdings in numerous technology and semiconductor companies.
Increased positions in selected energy, gold, and natural resource companies further suggest that its portfolio adjustments extended beyond simply shifting between individual stocks and ETFs.
Nevertheless, Form 13F data alone cannot establish that Bridgewater has become bearish on technology or expects inflation to rise. These filings reveal only part of the firm’s investment positions. (U.S. SEC, 2017; Investor.gov, n.d.)
BlackRock: Gradual Increases in Mega-Cap Technology Holdings and Greater Portfolio Concentration
BlackRock is one of the world’s largest asset managers, with a significant portion of its business dedicated to managing client assets through index funds, exchange-traded funds, and institutional accounts. (BlackRock, 2026a; Reuters, 2026; U.S. SEC, 2026b)
Its portfolio changes in the second quarter of 2026 reveal a different pattern from Bridgewater’s. While Bridgewater reduced its holdings in numerous technology companies, BlackRock reported modest increases in its shareholdings across many major technology stocks. (BlackRock, 2026a; Reuters, 2026)
BlackRock’s Largest Holdings
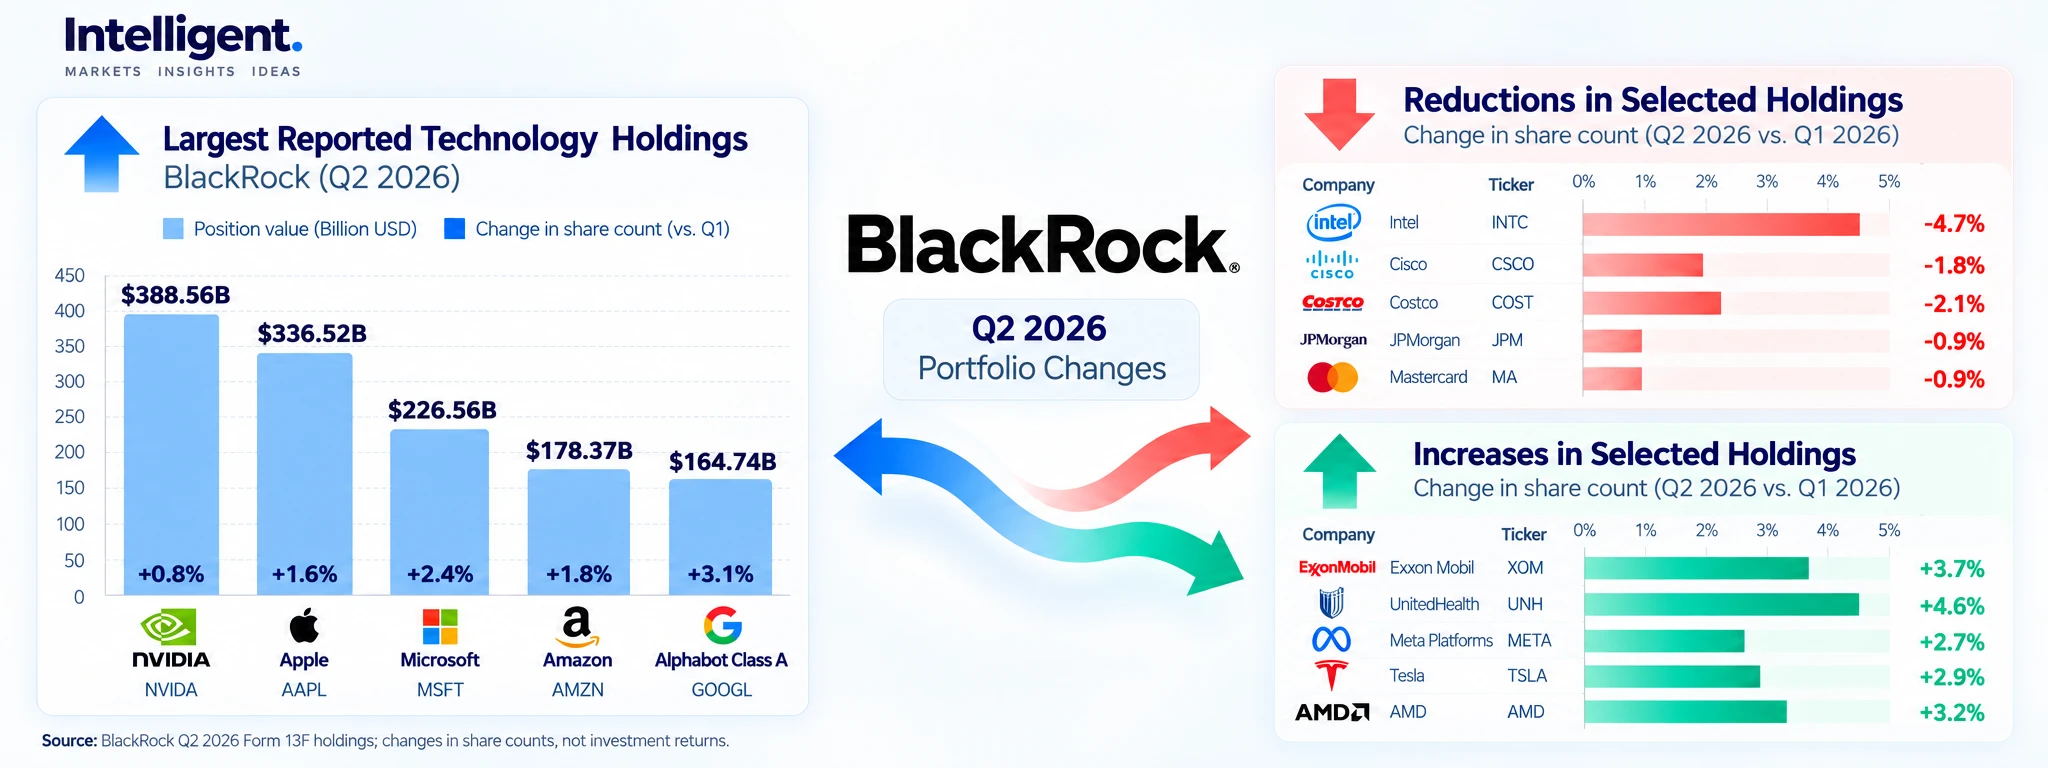
At the end of the second quarter, Nvidia was BlackRock’s largest reported position, with an estimated value of $388.56 billion. The firm held approximately 1.94 billion Nvidia shares, representing a 0.8% increase compared with the first quarter.
Apple ranked second, with a position valued at approximately $336.52 billion and a 1.6% increase in share count. Microsoft was the third-largest reported position, valued at $226.56 billion, following a 2.4% increase in shares held.
Figure 3. BlackRock reported modest increases in selected large-cap technology positions.
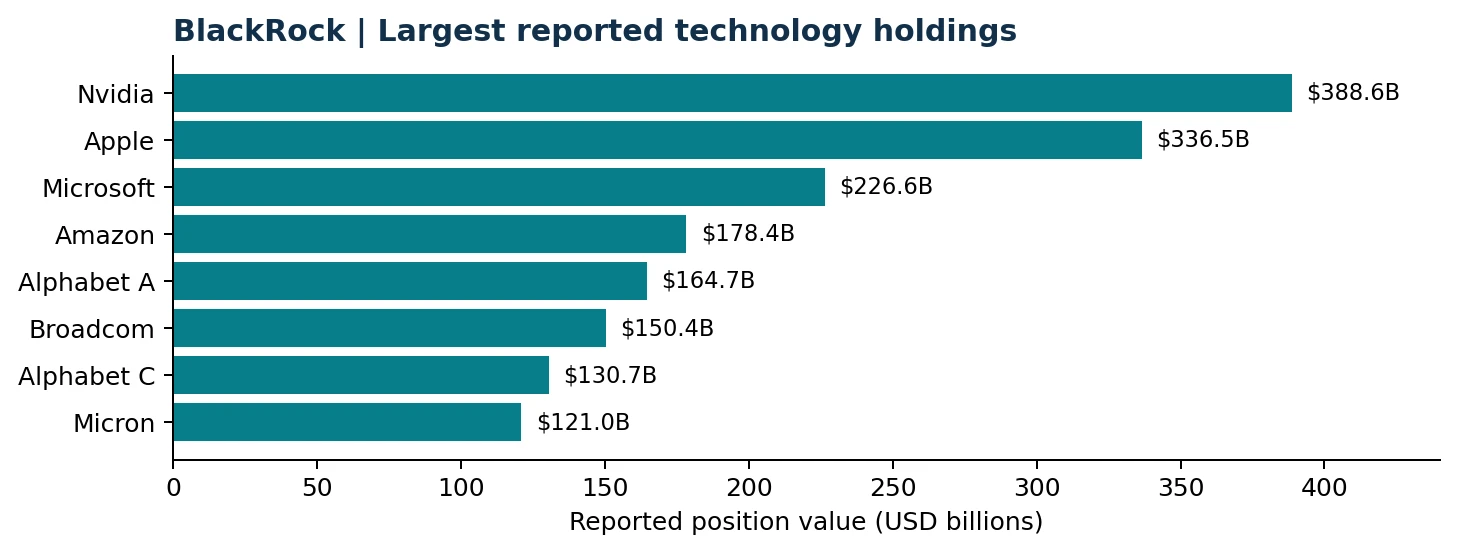
Among other major technology companies, BlackRock increased its holdings in Meta Platforms by approximately 2.7%, Tesla by 2.9%, and AMD by 3.2%.
These figures indicate that BlackRock increased its shareholdings in numerous large technology companies during the second quarter, although the increases were relatively modest compared with the overall size of its positions.
Reductions in Selected Industrial and Financial Holdings
BlackRock also reported reductions in several positions. Its Intel holdings declined by approximately 4.7%, while its positions in Cisco and Costco decreased by 1.8% and 2.1%, respectively.
Within the financial sector, the number of JPMorgan shares held fell by approximately 0.9%, while Mastercard holdings also decreased by 0.9%. Conversely, BlackRock increased its Exxon Mobil holdings by 3.7% and its UnitedHealth position by 4.6%.
Thus, increases in BlackRock’s shareholdings were not limited to technology companies, although mega-cap technology stocks continued to dominate its largest reported positions. (BlackRock, 2026a; Reuters, 2026)
Technology Exposure Rises to 35.3%
According to the portfolio composition analysis, the technology sector accounted for approximately 35.3% of BlackRock’s reported portfolio in the second quarter. This represented an increase of approximately 4.8 percentage points compared with the first quarter.
Greater technology exposure is significant because the performance of a relatively small group of large companies can have a substantial impact on portfolio returns.
However, an increase in a sector’s portfolio weight does not necessarily imply a proportionate increase in share purchases. Part of the change may result from rising market prices for companies within that sector. (State Street Global Advisors, 2026; iShares, 2026)
Why BlackRock’s Portfolio Changes Should Not Be Treated as Definitive Buy Signals
One of the most important considerations when analyzing BlackRock is the nature of its asset management business. (BlackRock, 2026a; U.S. SEC, 2026b; Reuters, 2026)
BlackRock manages substantial client assets through index funds and ETFs. Within this structure, changes in share counts may result from investor inflows, changes in benchmark index weights, or periodic portfolio rebalancing. (BlackRock, 2026a; BlackRock, 2026b; Reuters, 2026)
For example, a 0.8% increase in Nvidia holdings or a 1.6% increase in Apple holdings does not necessarily mean BlackRock’s portfolio managers made an active decision to increase their exposure to those companies.
For this reason, BlackRock’s Form 13F data are particularly useful for understanding institutional ownership structures, market concentration, and capital flow dynamics, rather than serving as standalone indicators of the firm’s directional investment views. (BlackRock, 2026b; U.S. SEC, 2017; Investor.gov, n.d.)
Berkshire Hathaway: How an Investment Holding Company Differs from Asset Managers
Berkshire Hathaway differs from Bridgewater and BlackRock in both its business structure and approach to capital allocation. (Berkshire Hathaway, 2026a; Berkshire Hathaway, 2026b; U.S. SEC, 2026c)
In addition to owning shares in publicly traded companies, Berkshire owns a diverse group of operating businesses across insurance, energy, transportation, and services. Its equity portfolio should therefore be analyzed within the context of the company’s broader financial and investment structure. (Berkshire Hathaway, 2026a; U.S. SEC, 2026c)
Unlike BlackRock, which manages substantial assets on behalf of clients, Berkshire allocates its own capital through a holding company structure. Consequently, changes in Berkshire’s equity positions may carry a different significance from changes in ownership reported by a large index fund manager. (Berkshire Hathaway, 2026b; BlackRock, 2026a)
A numerical analysis of Berkshire’s portfolio changes in the second quarter of 2026 requires a direct comparison of share counts and position values in its quarterly filings with those from the first quarter. Without that comparison, definitive conclusions about purchases or sales of specific companies cannot be drawn. (U.S. SEC, 2026c; Berkshire Hathaway, 2026a)
Comparing Investment Strategies: Three Different Approaches to Capital Management
Comparing Bridgewater, BlackRock, and Berkshire Hathaway highlights how differences in institutional structure affect the interpretation of portfolio changes. (Berkshire Hathaway, 2026a; BlackRock, 2026a; U.S. SEC, 2017)

In the second-quarter data, Bridgewater increased its index fund positions while reducing numerous direct technology holdings. BlackRock, by contrast, reported modest increases in its shareholdings across many major technology companies.
However, these differences do not necessarily indicate opposing views on the market’s outlook. Some of BlackRock’s changes may reflect client fund flows, whereas Bridgewater’s decisions may be influenced by different risk management and capital allocation considerations. (BlackRock, 2026a; Reuters, 2026; U.S. SEC, 2017)
Three Important Lessons for Investors
1. Reducing Direct Stock Holdings Does Not Mean Exiting a Sector
Bridgewater’s portfolio changes demonstrate that an investment manager can reduce direct holdings in technology companies while maintaining exposure to those same businesses through index-tracking funds. Analysts should therefore consider indirect exposure through ETFs alongside direct stock positions. (State Street Global Advisors, 2026; iShares, 2026)
2. Rising Institutional Ownership Does Not Always Signal Active Bullishness
At institutions such as BlackRock, changes in share counts may reflect client capital flows and the mechanics of index fund management. An increase in a company’s reported institutional ownership should not automatically be interpreted as a definitive buy signal without examining the underlying context. (BlackRock, 2026a; Reuters, 2026)
3. Form 13F Is a Starting Point for Analysis
Form 13F filings provide valuable information about observable changes in institutional portfolios, but they do not disclose every asset or risk exposure. To use these data effectively, investors should consider changes in share counts, position values, portfolio weights, market conditions, and the operating structure of each institution. (U.S. SEC, 2017; U.S. SEC, 2026a; Investor.gov, n.d.)
Conclusion: What Does Smart Money Signal in 2026?
Developments in the second quarter of 2026 demonstrate that major investment institutions follow different approaches to managing their equity market exposure.
Bridgewater adjusted its reported portfolio by increasing positions in SPY, IVV, and VOO while reducing numerous direct technology holdings. Greater exposure to selected energy, gold, and natural resource companies was another notable feature of its portfolio changes.
BlackRock, by contrast, reported modest increases in its shareholdings across many large technology companies. However, the nature of its business means these changes should be interpreted in the context of client asset management and index fund operations. (BlackRock, 2026a; Reuters, 2026)
Berkshire Hathaway, as an investment holding company, operates under a different capital allocation framework, and analyzing its transactions requires a direct review of its company-specific filings. (Berkshire Hathaway, 2026a; U.S. SEC, 2026c)
The central lesson for investors is that tracking smart money should not be reduced to copying the trades of major institutions. Instead, it should serve as a tool for understanding market structure, managing risk, and evaluating capital allocation decisions more effectively.
Disclaimer: This article is intended for educational and informational purposes only and does not constitute a recommendation to buy, sell, or hold any financial asset.
Source note: Quarter-over-quarter position figures are drawn from the portfolio dataset used for this analysis. The external references below corroborate filing rules, fund composition, institutional business models and corporate disclosures; they should not be treated as independent verification of every reported share-count change.
References
BlackRock. (2026a). Second quarter 2026 earnings release.
BlackRock. (2026b). Q2 2026 earnings release, Exhibit 99.1 (SEC filing).
https://www.sec.gov/Archives/edgar/data/2012383/000119312526304013/blk-ex99_1.htm
Berkshire Hathaway. (2026a). Form 10-Q for the quarter ended June 30, 2026.
https://www.sec.gov/Archives/edgar/data/1067983/000119312526341032/brka-20260630.htm
Berkshire Hathaway. (2026b). Second-quarter 2026 earnings announcement, Exhibit 99.1.
https://www.sec.gov/Archives/edgar/data/1067983/000119312526344495/d159922dex991.htm
Investor.gov. (n.d.). Form 13F reports filed by institutional investment managers.
iShares. (2026). iShares Core S&P 500 ETF (IVV): holdings and fund profile.
https://www.ishares.com/us/products/239726/ishares-core-sp-500-etf-ivv
Reuters. (2026, July 15). BlackRock assets hit record $15 trillion on boost from buoyant markets, ETF inflows.
https://www.reuters.com/business/blackrock-profit-jumps-buoyant-markets-boost-assets-2026-07-15/
State Street Global Advisors. (2026). State Street SPDR S&P 500 ETF Trust (SPY): fund holdings and benchmark.
https://www.ssga.com/us/en/individual/etfs/state-street-spdr-sp-500-etf-trust-spy
U.S. SEC. (2017). Division of Investment Management: Frequently asked questions about Form 13F.
https://www.sec.gov/files/divisions/investment/13ffaq.htm
U.S. SEC. (2026a). Form 13F and general instructions.
https://www.sec.gov/files/form13f.pdf
U.S. SEC. (2026b). BlackRock Inc. Form 10-Q for quarter ended March 31, 2026.
https://www.sec.gov/Archives/edgar/data/2012383/000119312526208766/blk-20260331.htm
U.S. SEC. (2026c). Berkshire Hathaway Inc. second-quarter 2026 Form 10-Q.
https://www.sec.gov/Archives/edgar/data/1067983/000119312526341032/brka-20260630.htm